
Patient care decisions must be made based on the current best evidence, and nurses critically appraise many kinds of research designs and their associated statistical analyses to determine what they know about a clinical issue. Learning commonly used terms is important in helping nurses understand research and how to use it in everyday clinical decision-making. (See Words to know.)
Ranking the evidence
A hierarchy of evidence ranks different types of research designs according to the confidence we can have in using that research for decision-making. Level I evidence, when done well, offers clinicians more confidence in the findings than does lower-level evidence. In the case of patient interventions, for example, the hierarchy ranges from the weakest design (Level VII), which consists of opinions of authors and expert committees, to the strongest design (Level I), which refers to systematic reviews of randomized controlled trials. A systematic review has a very specific method of finding, appraising, and synthesizing all of the known studies on a clinical topic (external evidence). These studies, all together, are referred to as a body of evidence.
In this article, we’ll focus on meta-analysis research design, which is a systematic review of quantitative studies that statistically compares findings across studies on a specific topic. (See Process for meta-analysis.) The results of each study are compared by finding a common statistic that allows researchers to speak to how the findings across the studies agree with each other. This agreement gives clinicians confidence in their decision-making, allowing them to tell their patients, with a degree of certainty, that the chosen treatment will lead to a defined outcome.
Clinical decision-making using forest plots and meta-analyses
First used in the 1970s and 1980s, forest plots can help demystify meta-analyses. At its most basic form, the forest plot is a graph of individual study findings within the meta-analysis. (See Example of a forest plot.) Bax and colleagues described forest plots as one of the more useful graphs for demonstrating comparison of findings across studies. However, forest plots are still a mystery to most clinicians.
When researchers measure and analyze outcomes in the same way, they can easily do a meaningful comparison across studies within a meta-analysis. However, this may not happen, making it necessary to use a common statistic to standardize the findings across studies. Researchers use effect size (EF) to compare study findings. The EF takes different forms depending on whether the study is a randomized controlled trial or a relationship study. Determining which EF is a good match for comparing findings across the studies allows researchers to compare apples to apples.
One common statistic is the mean, or average, such as the average score on a job-satisfaction scale. Other common statistics include weighted mean differences (WMD), absolute mean differences, and odds ratios (OR). All are forms of EF that are used to compare findings across studies. According to the standards set up by Cohen, a WMD or absolute mean difference greater than or equal to 0.2 is considered a small EF, medium is 0.5, and large is 0.8 or higher. When EFs are medium or above, researchers and clinicians can be confident that the intervention resulted in the desired outcome.
WMDs are pooled results of intervention studies in which the researchers measured the outcome variable with the same instrument but didn’t analyze it in the same way, perhaps because statistical analyses assumptions aren’t met. Weights are applied to studies’ findings based on sample size. Because the same measures are used for the same outcome across the studies, this simplifies interpreting the comparisons of WMDs. However, WMDs don’t work when studies have different measures for the same outcome variable, even with the same outcome definition across studies. For example, consider six studies about the impact of meditation on depression that all measured depression using the Beck Depression Scale (common measure of outcome). Three of the six studies had 300 to 500 participants in their sample and the other three had 30 to 100 participants, making the study results challenging to compare. The common WMD statistic would help us compare results across these studies because their outcomes were measured in the same way. This helps us conclude what we know about how meditation affects depression.
Another possible scenario for a common comparison of study findings would be when an outcome could be a yes or no (dichotomous), such as a patient surviving or not. For these studies, the common statistic is an OR, which helps us understand how likely an outcome will occur relative to whether the study participant had been exposed to a treatment (independent variable) or to a particular condition, such as a disease or diagnosis.
In addition to the single standardized statistic for each study’s findings, an overall statistic represents the cumulative result of comparing findings across the studies within the analysis. The overall statistic holds the key to what we know about this clinical issue, which guides our clinical decision-making. The benefit of this approach is that clinicians can read one recently published, well-done meta-analysis and determine if an intervention works well across several studies. The goal for using a forest plot overall statistic within a meta-analysis is for researchers to draw a conclusion from the body of evidence and make clinical practice recommendations.
Forest plot explained
A forest plot provides a visual mechanism to help us understand the results of a meta-analysis. To deconstruct a forest plot, ask these three questions:
- Did the intervention work?
- Can I get what they got, if I do what they did (in the studies that worked)?
- Are the results statistically significant (not found by chance)?
Did the intervention work?
The answer to this question tells us whether the intervention did what was expected. All results are clinically important, including positive, negative, and no difference, as well as small and large findings. Although each study provides a study statistic (for example, comparing mean differences), the statistic can’t be compared directly because some studies have small samples that influence their findings’ generalizability. Therefore, individual study findings are weighted by sample sizes before being analyzed in the meta-analysis. This weighted statistic is the numeric value that reflects the magnitude of the effect of the intervention. In other words, how big was the effect?
The diamond on the bottom of the forest plot indicates the overall statistic (effect) from all of the studies and tells us whether the intervention worked. The vertical points of the diamond represent what we know from the body of evidence, and the horizontal points represent the precision of the overall effect (the confidence interval [CI]). For more information about CI, refer to He Z, Fineout-Overholt E. Understanding confidence intervals helps you make better clinical decisions. Am Nurse Today. 2016;11(3).
The size of each square in a forest plot represents the weight or influence each study carries in the meta-analysis based on the sample size and the CI. Bigger squares represent more participants and usually have narrower CIs, exerting more influence on the overall statistic. The EF magnitude is indicated by the square’s position on the horizontal scale line and in the overall statistic at the bottom of the forest plot. Weighting gives us a standardized way to compare findings across individual studies within the meta-analysis.
When interpreting the individual study results and the overall meta-analysis results, consider the evaluated outcome. If the outcome was something desirable (for example, stopping smoking), the square that occurs on the right side of the line of no effect (a vertical line representing no difference) indicates the intervention worked. If the outcome was something undesirable (for example, death), the square that occurs on the left side of the line of no effect indicates the intervention lessened the undesirable outcome. To check yourself, use all of the information you’ve learned in this section to interpret the individual and overall results depicted in the Example of a forest plot.
Can I get what they got, if I do what they did?
The second question is concerned with how the results across the studies translate into practice. In the Example of a forest plot, the horizontal lines represent the CI. Sometimes called the whiskers of the square, this line is interpreted two ways. First, a narrow CI is represented by a short whisker line, indicating that the statistic is a precise study estimate, which means clinicians can be confident in expecting similar results in their practice when they implement the study intervention. Conversely, if the CI is wide, it’s less precise and clinicians can’t trust that they’ll get similar results.
Are the results statistically significant?
The answer to this question is found in the line of no effect, which indicates a mean difference of 0 between the intervention and the control. CIs that cross this line indicate findings that are not statistically significant. CIs that don’t cross the line of no effect indicate statistically significant findings that are less likely to be found by chance. The same is true with the diamond; if the horizontal portion of the diamond crosses the line of no effect, the overall finding is not statistically significant.
In the case of OR, the line of no effect is a numeric value of 1, instead of a 0 as for a WMD, indicating that the intervention neither increased nor decreased the likelihood that the outcome occurred in the intervention group. Similarly, squares on the left of the line of no effect show a decreased likelihood (decreased odds) of the outcome, and those on the right show an increased likelihood for the outcome occurring as a result of the intervention.
Clinical implications of using findings from meta-analyses
Nurses have an ethical obligation to use the best knowledge available in their daily decision-making. Meta-analyses provide the best source of this latest, best evidence. With a basic understanding of the elements of a forest plot and skills to quickly interpret findings across a body of evidence, nurses gain confidence in their care decisions. With the knowledge and skills to read and interpret forest plots, nurses can successfully guide practice changes to update procedures and ensure that each patient has the best outcome.
Editor’s note: Now take time to practice interpreting a forest plot.
Show what you know: Interpret a forest plot
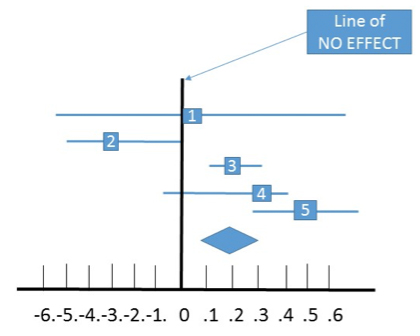
Test yourself by evaluating and interpreting this forest plot. The created effect sizes of five randomized controlled trials examining counseling on smoking cessation ranged from no effect (0) in Trial 1 to a moderate effect (0.5) in Trial 5. Note the CIs. Are they wide or narrow? Based on the effect size and the CI, which of the study findings are reliable? Note the overall effect. Would you recommend that patients have routine counseling for smoking cessation?
Show What You Know: QUIZ
Here are two quiz questions for you to further evaluate your forest plot skills.
1. In a forest plot, the square represents which of the following?
a. Sample size of the study
b. Study results statistic
c. Confidence interval
d. Range of values that could have resulted in the study
2. The forest plot allows the reader to see which of the following at a glance?
a. Only the overall statistic comparing across studies
b. Only the individual studies’ results statistics
c. Only the confidence interval for each study statistic
d. All of the above
Click to find the Answers to the quiz questions and the correct interpretation of the forest plot.
Both authors work at the University of Texas at Tyler. Ellen Fineout-Overholt is the Mary Coulter Dowdy Distinguished Professor of Nursing. Zhaomin He is an assistant professor and biostatistician of nursing.
Selected references
Bax L, Ikeda N, Fukui N, et al. More than numbers: The power of graphs in meta-analyses. Am J Epidemiol. 2009;169(2):249-55.
Callcut RA, Branson RD. How to read a review paper. Respir Care. 2009;54(10):1379-85.
Cohen J. A power primer. Psychol Bull. 1992;112(1):155-9.
Faraone SV. Interpreting estimates of treatment effects: Implications for managed care. P T. 2008;33(12):700-11.
Freiman JA, Chalmers TC, Smith H Jr, Kuebler RR. The importance of beta, the type II error and sample size in the design and interpretation of the randomized control trial. Survey of 71 ‘‘negative’’ trials. N Engl J Med. 1978;299(13):690-4.
He Z, Fineout-Overholt E. Understanding confidence intervals helps you make better clinical decisions. Am Nurse Today. 2016;11(3).
Heavey E. Differentiating statistical significance and clinical significance. Am Nurse Today. 2015;10(5);26-8.
Lewis JA, Ellis SH. A statistical appraisal of post-infarction beta-blocker trials. Primary Cardiol. 1982;(suppl 1):31-7.
Lipsey MW, Wilson DB. Practical Meta-Analysis. Thousand Oaks, CA: Sage Publications, Inc.; 2001.


