
Don’t let lack of statistics knowledge keep you from engaging in projects to improve patient care.
Takeaways
- Use the specific aim and/or hypothsis of your project to guide selection of measures.
- Select statistics for the analysis phase based on the level and distribution of data for the main variables in your project aim/hypothesis.
- Choose display options to transform your results into actionable data that can inform and impact practice.
If the statistics are boring, then you’ve got the wrong numbers. —Edward Tufte, statistician and professor emeritus of political science, statistics, and computer science at Yale University (Tufte 2001)
Data and statistics are the building blocks of quantitative research and quality improvement (QI). Without them, we don’t know if a problem exists or if a change led to improvement. Understanding basic statistical terms, concepts, and analyses will help you successfully plan and implement your project. Underlined terms in this article are defined in Common statistics terms.
Common statistic terms: Learn these terms to help you better develop and disseminate research data.
Articulate your aim
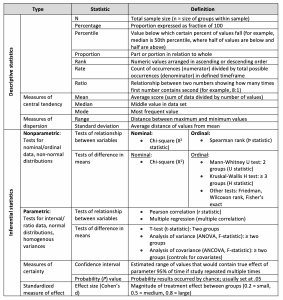
Start by identifying your project’s aim/hypothesis and then consult a statistician (or knowledgeable colleague) about choosing valid and reliable measures for variables in your aim and planning data analysis. Your analysis will always include descriptive statistics (for example, counts/percentages, central tendency/dispersion measures) to summarize sample characteristics and key measures. Some projects will use inferential statistics to draw conclusions from the data.
Identify data you need to measure
Understanding the level of data (nominal, ordinal, and interval/ratio) for each variable you plan to measure will guide your analysis and statistical reporting.
Nominal data
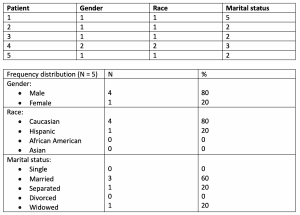
Nominal data (categorical data), the lowest level, represent discrete categories without true numeric values. Examples include marital status, ethnicity, and diagnosis. By assigning a number to category options (for example, 1 for male and 2 for female), you can enter these data into a database to count occurrences. Then summarize counts in frequency distributions to display the number (N) and percentage of occurrences of each value. For example:
Ordinal data
Ordinal (categorical) data can be ranked from lowest to highest. No standardized value exists between each measurement, so intervals aren’t necessarily equal. Examples include educational level or variables measured on Likert scales (for example, health status perceptions). Summarize ordinal data with frequency distributions or measures of central tendency (mean, median, mode). Here’s an example of ordinal data:
| Educational Levels (years) | Median | Range |
| Dataset: 8,8,9,9,9,10,11,11,12,12,14,14,14,16,16,16
| 11.5 | 8.0-16.0 |
Median = average of two middle numbers in an even number set
Interval/ratio data
Interval/ratio data are quantitative and represent true numeric values. These continuous data have equal distances between each value; however, ratio data have an absolute zero, so negative values aren’t possible. Ambient temperature is an example of interval data; age, heart rate, and hemoglobin are examples of ratio data. Summarize interval/ratio data with frequency distributions, measures of central tendency (mean, median, mode), and/or measures of dispersion (range, standard deviation [SD]). Here’s an example of interval/ratio data:
| Pain (0-10) | Mean | SD | Range |
| Acute pain | 4.58 | 2.03 | 2.0-9.5 |
| Chronic pain | 6.08 | 1.85 | 1.0–9.0 |
The median should be used if the distribution of ordinal or continuous interval/ratio data is skewed because the mean is heavily influenced by outliers (such as distant values, as is the case with 25 and 48 in the example below).
| Depression scores | Median | Range |
| 6, 6, 6, 6, 7, 7, 9, 10, 12, 25, 48 | 7.0 | 6.0-48.0 |
Median = middle number with odd number set
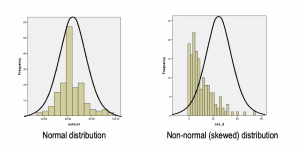
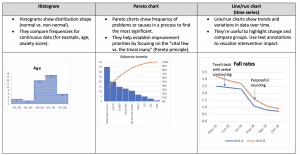
How do you know if the distribution is skewed? After entering data into a spreadsheet like Excel, run a histogram for each variable to assess the shape of the distribution.
In QI projects, you may need to calculate a rate for nursing quality indicators such as falls and central line bloodstream–associated infections. Rates are calculated by dividing the number of occurrences (numerator) by the total sample size in a defined timeframe (denominator) and multiplying by 1,000. For example, if a medical-surgical unit had three falls in a quarter with 476 patient days, the fall rate would be 6.3 (3/476 X 1,000). This equation standardizes occurrences based on volume, which allows you to compare performance against external benchmarks over time.
Inferential tests
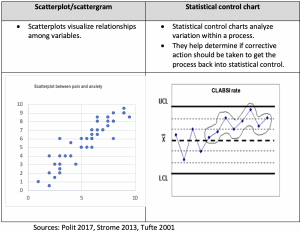
Two common types of inferential tests examine relationships among variables or difference in means. The test you select should be based on the level and distribution of data. If the distribution approximates a bell-shaped curve, the assumption of normality is met, so use parametric tests and perform calculations using means/standard deviations. With non-normal (skewed) distributions, use nonparametric tests because they don’t rely on the normality assumption; perform calculations with medians or ranks.
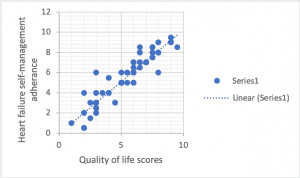
Tests of relationship examine how variables may be correlated. Correlations range from -1.0 to +1.0. A positive correlation occurs when both variables increase together. Example output of a positive correlation (r-statistic) is 0.45. This scatterplot shows a strong positive correlation:
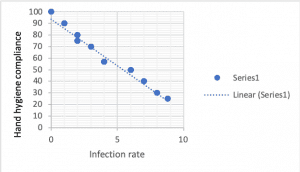
Negative correlations occur when one variable increases and the other decreases. Example output of a negative correlation (r-statistic) is -0.32. This scatterplot shows a near-perfect negative correlation:
Tests of difference are used to compare mean scores of key variables between groups.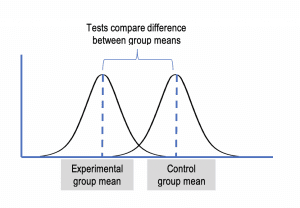
Analyze statistical significance
After you have statistical output, how do you determine if results are meaningful? Statistical significance is indicated by the probability (P value) associated with the test (such as a Pearson correlation or t-test [t-statistic]). If the P value is < .05, the results are statistically significant, meaning a 95% probability exists that the results represent a true relationship/difference not due to chance. Sample size can affect the ability to detect significance. If you study too few subjects, a statistical difference might be present but you may not be able to detect it (type II error). If you use too large a sample, you’ll likely find statistical (but negligible) differences that aren’t clinically meaningful (type I error).
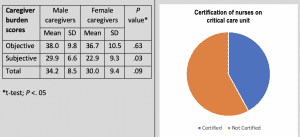
For example, 50 nurses participated in an 8-week mindfulness-based stress reduction (MBSR) program (experimental group) and 50 nurses served as controls (no MBSR). All nurses recorded daily anxiety scores that were averaged weekly for 8 weeks. You ran a t-test (test of difference between means) because you had two groups and anxiety was measured on a quantitative (ratio) scale.
| Mean | Standard deviation | t-statistic | P value | |
| Control group | 62.7 | 3.03 | 3.32 | .03 |
| MBSR group | 51.4 | 1.85 |
The P value for the t-statistic (3.32) is < .05. The difference in mean anxiety scores between the groups is statistically significant, indicating anxiety among nurses may be reduced by MBSR.
Clinical significance involves identifying the minimally important difference that would be substantial enough to be deemed clinically important. As noted above, an 11-point drop in anxiety could be considered clinically meaningful; however, if the anxiety scores differed by only 3 points (for example, if the control group was 62.7 and the MBSR group was 59.7), one might argue that the MBSR effect isn’t clinically important because the treatment effect is very small. The effect size determines clinical importance. Note that confidence intervals are a more precise estimate of treatment effect and are being reported more frequently in research.
Turn data into actionable information
The goal of displaying data is to turn them into information that provides knowledge for practice. Displays should simplify understanding of key data points and highlight trends and differences to facilitate comparison. (See Choosing the right displays.) Choose options that communicate your data’s messages. (See Display options.) You’ll need more than one approach to describe your sample and results. Examples from the literature that use these display options can be found in the reference list.
Choosing the right displays: Your project aims will determine how you want to display your data. Choosing the right displays will help you communicate your message.
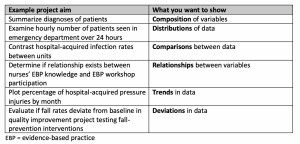
When you present actionable data, you can influence key stakeholders to make effective decisions about possible changes suggested by your results. And don’t stop dissemination with internal audiences. Present your results beyond the walls of your unit or organization to make the greatest impact.
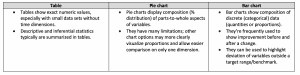
Display options: The table below will help you choose which options fit best for displaying your data. Note the examples below each description.
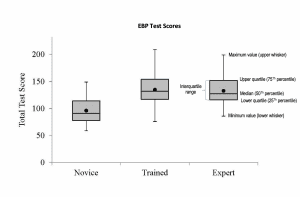
 Box Plot:
- Box plots describe characteristics of distribution of continuous data.
Margo Halm is associate chief nurse executive for nursing research and evidence-based practice at VA Portland Healthcare System in Portland, Oregon.
References:
Aiken LH, Clarke SP, Sloane DM, Sochalski J, Silber JH. Hospital nurse staffing and patient mortality, nurse burnout, and job dissatisfaction. JAMA. 2002;288(16):1987-93.
Display examples: Counts/percentages; mean/SD; odds ratios; confidence intervals
Beckett CD, Kipnis G. Collaborative communication: Integrating SBAR to improve quality/patient safety outcomes. J Healthc Q. 2009;31(5):19-28. onlinelibrary.wiley.com/doi/full/10.1111/j.1945-1474.2009.00043.x
Display examples: Counts/percentages; mean/SD; Mann Whitney tests; confidence intervals; effect size
Bridges E, Whitney JD, Burr R, Tolentino E. Reducing the risk for pressure injury during combat evacuation. Crit Care Nurse. 2018;38(2):38-45.
Display examples: Counts/percentages; mean/SD; repeated measures ANOVA; line charts
Chopra V, Kuhn L, Vaughn V, et al. Does certification in vascular access matter? An analysis of the PICC1 survey. Am J Nurs. 2017;117(12):24-34.
Display examples: Counts/percentages; Chi-square; Fisher Exact tests
Fairbanks CB. Using Six Sigma and Lean methodologies to improve OR throughput. AORN J. 2007;86(1):73-82.
Display examples: Regression; histogram; Pareto chart; control chart; box plot; scatterplot
Golino AJ, Leone R, Gollenberg A, et al. Impact of an active music therapy intervention on intensive care patients. Am Crit Care. 2019;28(1):48-55.
Display examples: Counts/percentages; median; range; t-tests; confidence intervals
Halm M, Bailey C, St Pierre J, et al. Pilot evaluation of a functional pain assessment scale. Clin Nurse Spec. 2019;33(1):12-21.
Display examples: Counts/percentages; mean/SD; range; Spearman rank correlations; t-tests; Kruskal-Wallis tests
Kappel SE, Larsen-Engelkes TJ, Barnett RT, et al. Creating a culture of mobility: Using real-time assessment to drive outcomes. Am J Nurs. 2018;118(12):44-50.
Display examples: Counts/percentages; median; range; Chi-square; Wilcoxon rank test; Spearman rank correlations; box plots; scatterplots
Knill L, Maduro R, Payne JE. Targeting zero CAUTIs. Am Nurse Today. 2018;13(11):54-7.
Table displays: Rates; bar charts
McNeill MM. Critical care performance in a simulated military aircraft cabin environment. Crit Care Nurse. 2018;38(2):18-29.
Display examples: Counts/percentages; mean/SD; Chi-square, t-tests; box plots
Morton JC, Brekhus J, Reynolds M, Dykes AK. Improving the patient experience through nurse leader rounds. Patient Exp J. 2014;1(2):53-61.
Display examples: Percentile ranks; bar charts; control charts
Murphy T, Laptook A, Bender J. Sustained improvement in neonatal intensive care unit safety attitudes after teamwork training. J Patient Saf. 2018;14(3):174-80.
Display examples: Counts/percentages; median; Chi-square; line charts
Oh HS, Seo WS. Systematic review and meta‐analysis of the correlates of cancer‐related fatigue. Worldviews Evid Based Nurs. 2011;8(4):191-201.
Display examples: Effect size; confidence intervals
Polit DF, Beck CT. Nursing Research: Generating and Assessing Evidence for Nursing Practice. 10th ed. Philadelphia: Lippincott Williams & Wilkins; 2017.
Quinn BL, Solodiuk JC, Morrill D, Mauskar S. Pain in nonverbal children with medical complexity: A two-year retrospective study. Am J Nurs. 2018;118(8):28-37.
Display examples: Counts/percentages; mean/SD; range, median; bar chart
Strome TL. Healthcare Analytics for Quality and Performance Improvement. Hoboken NJ: John Wiley & Sons; 2013.
Tsai PF, Kitch S, Chang JY, et al. Tai chi for posttraumatic stress disorder and chronic musculoskeletal pain: A pilot study. J Holist Nurs. 2018;36(2):147-58.
Display examples: Counts/percentages; mean/SD; t-tests
Tufte ER. The Visual Display of Quantitative Information. Cheshire, CT: Graphics Press; 2001.
Vitorino LM, Soares RCES, Santos AEO, et al. Two sides of the same coin: The positive and negative impact of spiritual religious coping on quality of life and depression in dialysis patients. J Holist Nurs. 2018;36(4):332-40.
Display examples: Counts/percentages; means/SD; confidence intervals; Pearson correlations; multiple regression