Clarify your message to enhance your reach.
- Visual abstracts provide a short graphic synopsis of key points contained in your scholarship.
- A visual abstract can be used on social media, online, and traditional platforms to disseminate your scholarship and generate interest across a wider audience.
Disseminating scholarly work (research, quality improvement projects) is critical to affecting change. You want your work to have as much impact as possible, whether in the form of a presentation or an article. Your capacity to impact positive change can increase exponentially when you maximize exposure to your work using innovative strategies that promote it and widen your audience. Visual abstracts, for example, are a proven tool for sharing information about your implementation or research projects. According to Ibrahim, a prospective case-control crossover study that analyzed views, retweets, and engagement on a social media platform showed that visual abstracts had 3.5 times more engagement than sharing key figures and 5 times more engagement than sharing article citations.
Why visual abstracts?
In a fast-paced society, delivering concise and compelling reasons to view your work creates an edge and expands your potential audience. Visual abstracts, similar to traditional abstracts, provide a short synopsis of key points contained in your scholarship, but in a graphic format. They allow you to leverage the old adage, “a picture is worth a thousand words,” saving the time necessary to read though a written abstract while adding a dimension of visual appeal not found in text. That becomes even more appealing when we understand that Martin reported the following in her 2020 article: 90% of information taken into the brain is visual, and we process images 60,000 times faster than text. Studies show that 3 days after reading, recall increases from 20% to 65% if a picture is added to the text. In addition, 65% of the population prefers to learn in a visual format and judge their learning to be more effective when presented in a style they’re confident using.
How do I create a visual abstract?
Ibrahim compares visual abstracts to movie trailers. They allow readers to determine if they want to read the study or move on to the next. And just as well-designed movie trailers generate buzz for an upcoming movie, sound design principles ensure a successful visual abstract by highlighting critical elements that help spark discussion.
Redulla describes key design principles for poster presentations, highlighting the role of proper font, color, and image selection to create engaging posters (myamericannurse.com/creating-a-compelling-poster/). You can apply these same core design principles, and others, to your visual abstract.
Clear messaging
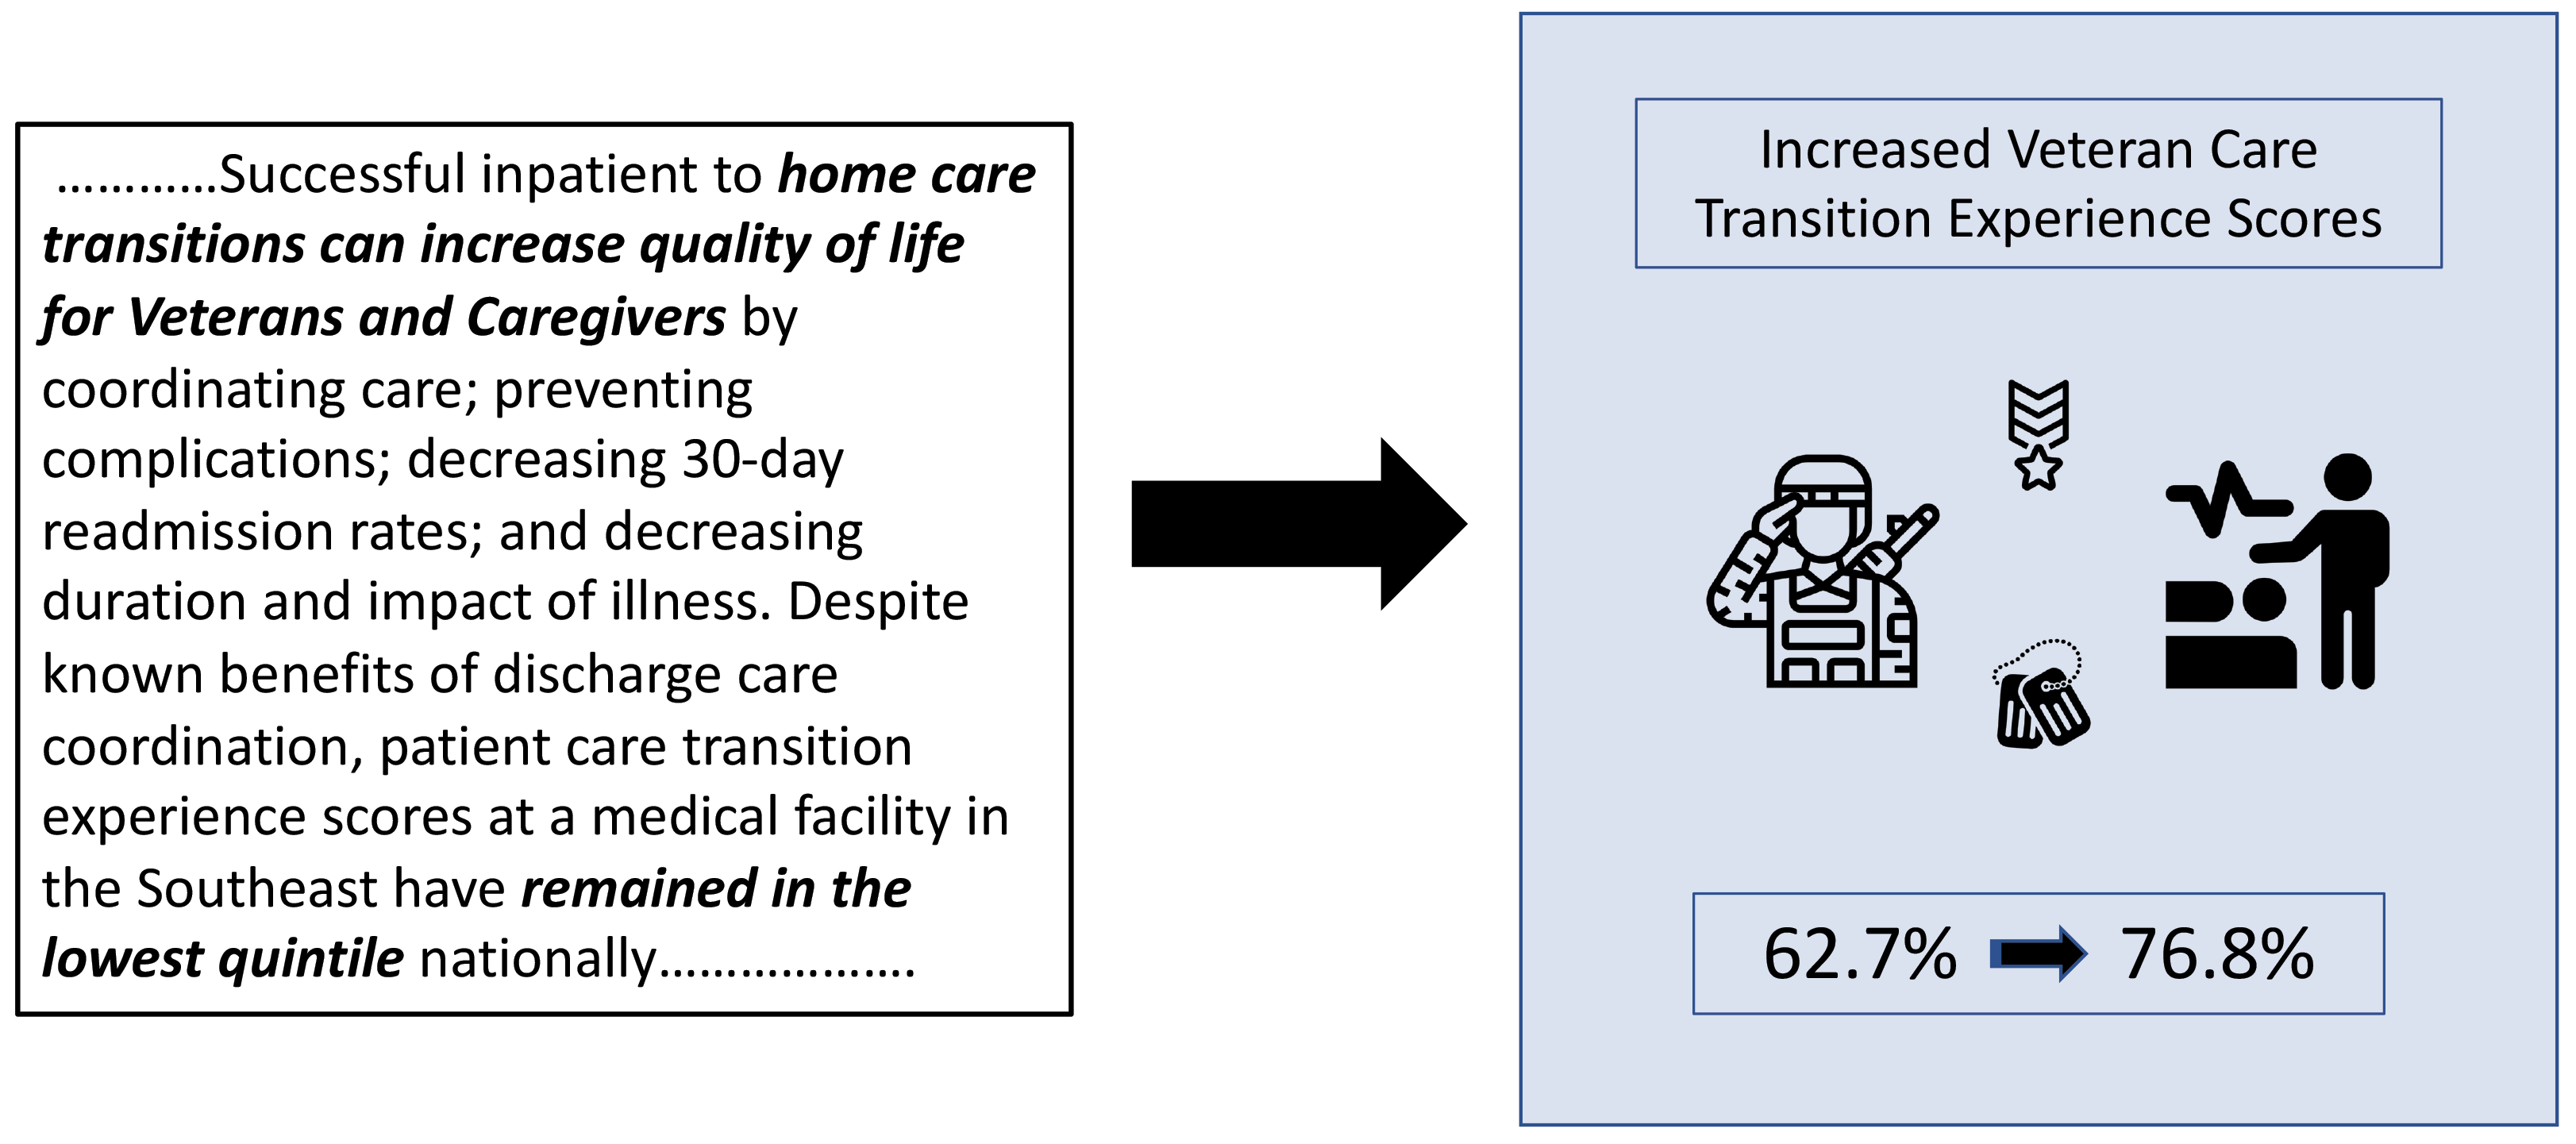
How do you take a 5,000-word manuscript and distill it down to a one-page visual abstract? Focus on a clear message. First, orient yourself to your user’s experience. Review the study to identify important takeaways. Filter information by deciding what your target audience wants to know about the study, and simplify messaging to highlight key points relevant to your audience. Next, create an engaging visual abstract that accurately reflects a couple of crucial study outcomes. Based on feedback from your audience, you can make future revisions, if necessary. Remember that clarity trumps creativity. Your goal is to share essential information, so don’t let design distract you from clear messaging. (See From text to visual.)
Software choices
You can easily create a visual abstract using Microsoft PowerPoint or Apple Keynote. Create the visual abstract on one slide, similar to an electronic poster. To create a more robust visual abstract, you can use the slightly more expensive Adobe Photoshop Suite. However, creating an esthetically pleasing and effective visual abstract doesn’t require purchasing high-functioning graphic software. To support your mastery of whatever software option you choose, consider accessing free online tutorials, blogs, and videos.
Triptych format
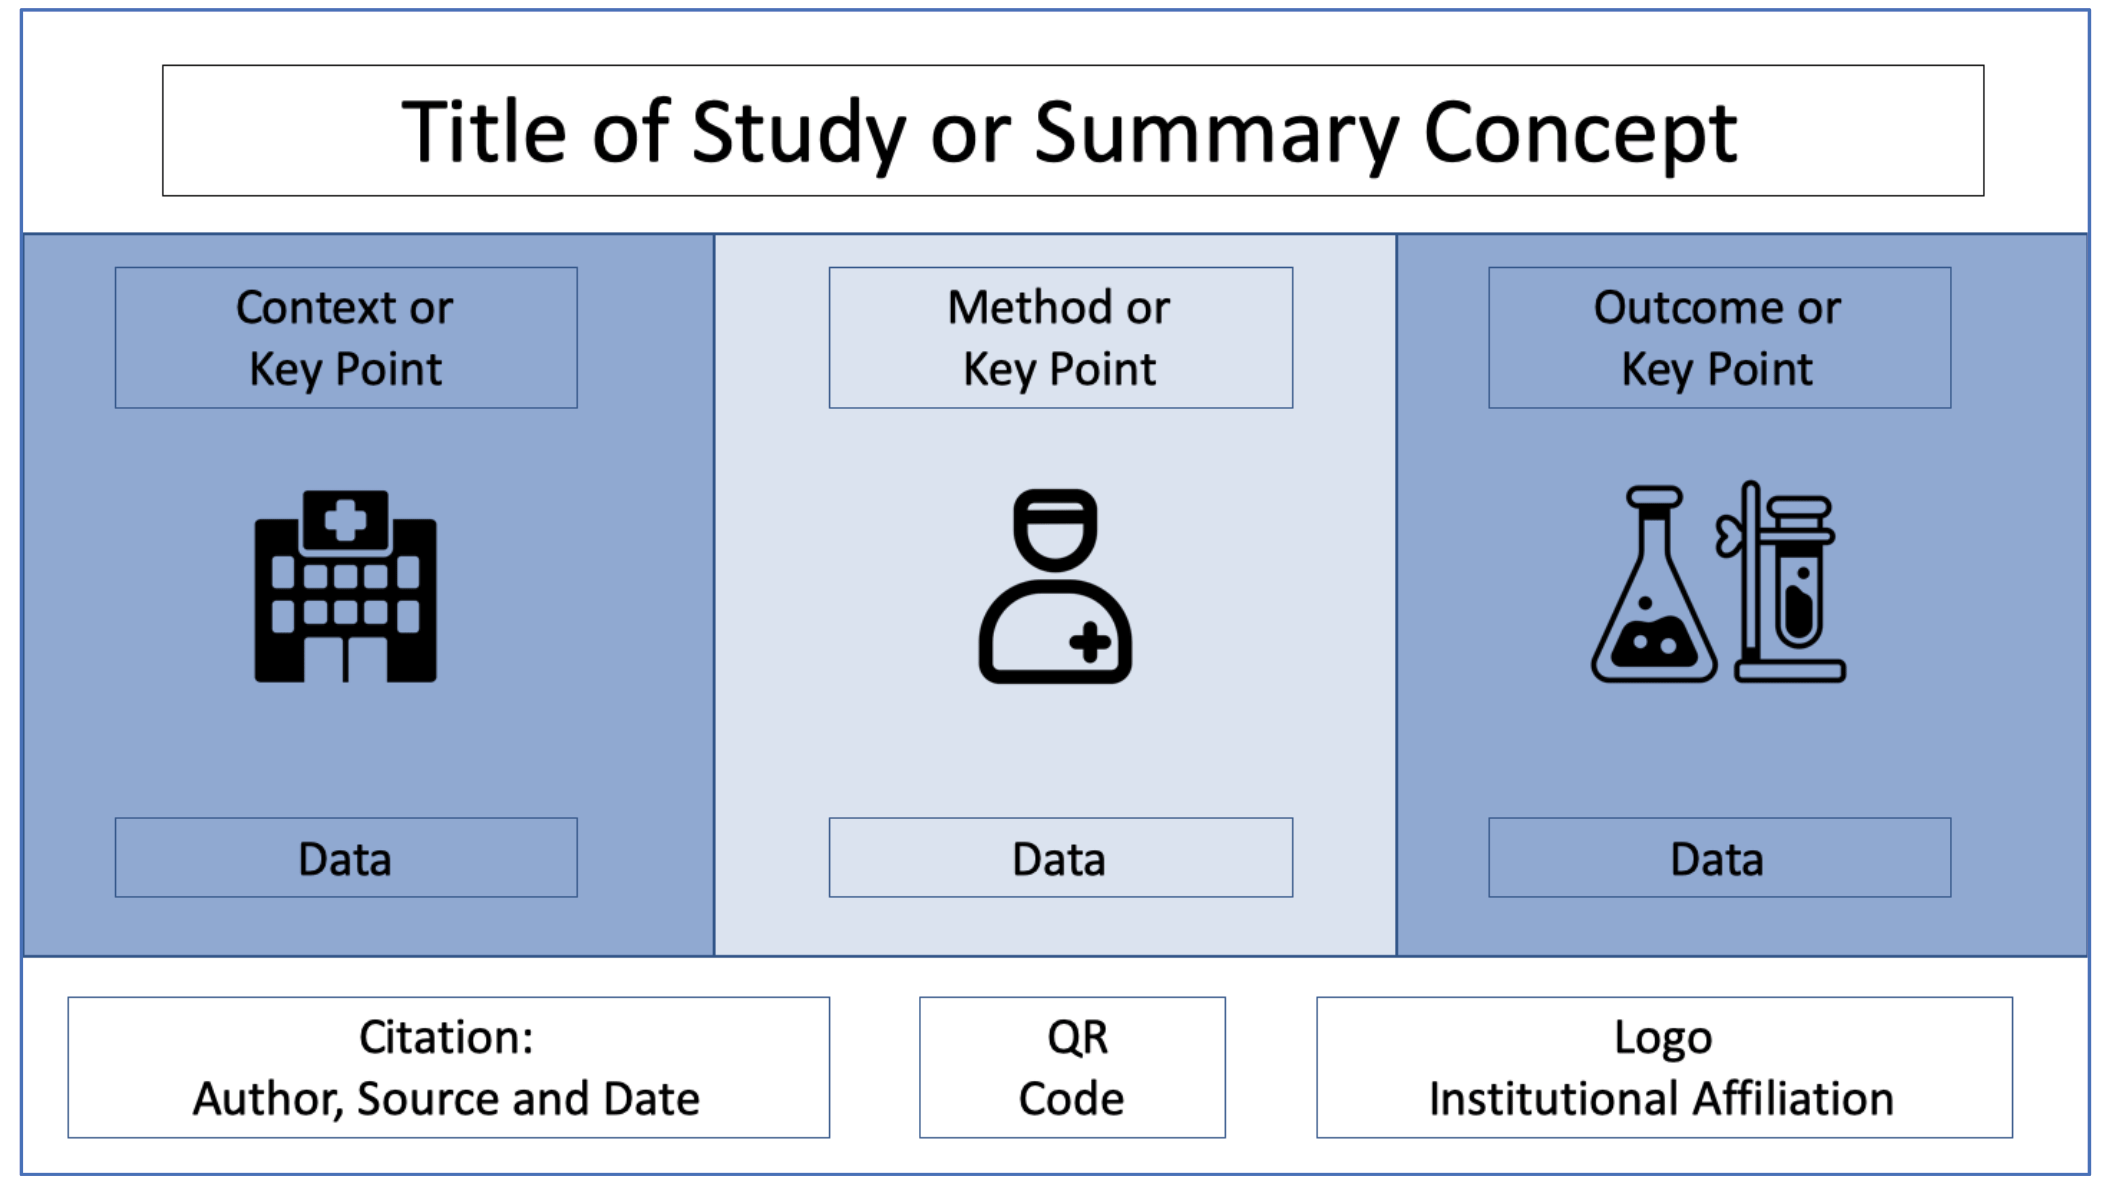
Traditionally, visual abstracts use a triptych (three-panel) layout. For the title, use the name of the study or capture the key study concept. Dedicate each of the three panels to a specific study or project element: context, study, outcomes. However, if this traditional placement doesn’t fit your study or interferes with clear messaging, modify it.
Each panel should include a brief description, a large visual illustration, and outcome data. Along the bottom of the visual abstract, include author names, affiliations, and citations or links to additional information, such as the published article, poster, or graphs and samples. (See Easy as 1, 2, 3.)
Although the triptych is considered the classic visual abstract design, others are permitted. You can reduce panels or change the orientation from horizontal to vertical if that makes more sense. Remember, visual abstracts are versatile and the ultimate goal is clear messaging.
The right images
To enhance your visual abstract with appropriate images, access various online resources such as Noun Project (nounproject.com) and Iconfinder (iconfinder.com). You also can create original images yourself or hire a graphic designer. To support creating your own images, consider using software such as Adobe Paint or taking advantage of the free online image editor Pixlr (pixlr.com/editor). As required, images should include copyright permissions. For copyright information, visit copyright.cornell.edu/publicdomain.
Content and layout
If you’re creating a visual abstract for a journal, review author guidelines for information about size, word count, and template requirements. Next, choose the title. Use simple language with keywords that catch viewers’ attention and best describe your research. If using the three-panel layout, think about how you want to display your work. Consider drawing your layout first and then applying it to your software choice. Start by prefilling your abstract with the title, author names, logos, or journal/conference information. Next, describe your outcomes in short phrases across the top of the boxes. After you quantify results, add numeric outcomes in each text box. Last, add visual images that illustrate the described outcomes.
Review and feedback
You’ll probably share your visual abstract online. However, after it’s posted you may face difficulty retracting it. To avoid potential embarrassment as a result of an error and to clarify important concepts, designate someone to edit your visual abstract and provide feedback. In the end, this step will increase your goal of connection and impact on a wider audience.
How do I use a visual abstract?
Think of a visual abstract as an advertisement for your scholarship, so display it somewhere that maximizes exposure to potential viewers. Social media, online, and traditional platforms all offer opportunities for garnering interest.
Social media
Social media platforms such as Twitter, LinkedIn, and Facebook are the original medium for visual abstracts. They allow you to disseminate your work to large audiences with shared interests by using hashtags (placing the pound sign in front of searchable key words), which reduce the time needed for traditional networking.
To maximize your reach on Twitter, for example, tag the authors and institutions along with the topic, so that all interested parties will be alerted to the post. Encourage colleagues to tag and share on their own accounts by retweeting your post. You also can place a QR code on the visual abstract to give viewers easy access to additional information such as the published article, a poster, or a registration link to attend your presentation.
The number of journals requesting visual abstracts to accompany manuscripts has increased. Some journals provide visual abstract guidelines and instructions for authors. If the journal you’re working with doesn’t make this request, reach out to the editor to discuss using a visual abstract to bring more readers to your article.
Online presentations
In an online environment, users may face challenges (with screen limitations or technology navigation) when trying to view the detail found in a traditional scientific poster. Visual abstracts overcome these challenges by placing more emphasis on images rather than text. Visual abstract oral presentations (combining the visual abstract with a poster synopsis), which some conferences may request, create interest and encourage viewers to visit poster displays or take a closer look at virtual posters.
Traditional
Visual abstracts aren’t limited to digital or online formats. You can display them in gathering spaces at professional conferences or events to serve as conversation starters for attendees and to enhance event engagement. Also use them to convey the impact of your work during high-stakes meetings or in time-limited presentations.
Share outcomes
Visual abstracts provide a unique opportunity for disseminating your research, projects, and other scholarly work to a wider audience. When you can engage viewers quickly, you enhance your ability to share the positive outcomes of your efforts so they can be implemented in other settings.
Shannon S. Layton, Stephanie Hammond, and Cori C. Johnson are assistant professors at the University of Alabama Birmingham School of Nursing. David James is program development manager at the University of Alabama at Birmingham Hospital.
References
Bhargava P, Awan OA. Mastering presentation Zen: How to improve presentation design and educational impact. Curr Probl Diagn Radiol. 2021;50(5):571-3. doi:10.1067/j.cpradiol.2020.11.008
Durso FT, Pop VL, Burnett JS, Stearman EJ. Evidence-based human factors guidelines for PowerPoint presentations. Ergon Des. 2011;19(3):4-8. doi:10.1177/1064804611416583
Ibrahim AM, ed. Use of a Virtual Abstract to Disseminate Scientific Research. 4th ed. SurgeryRedesign; 2018. static1.squarespace.com/static/5854aaa044024321a353bb
0d/t/5a527aa89140b76bbfb2028a/1515354827682/VisualAbstract_Primer_v4_1.pdf
Martin K. A picture is worth a thousand words. Med Writ. 2020;29(1):28-34.
Ramos E, Concepcion BP. Visual abstracts: Redesigning the landscape of research dissemination. Semin Nephrol.
2020;40(3):291-7. doi:10.1016/j.semnephrol.2020.04.008
Redulla R. Creating a compelling poster. Am Nurse J. 2021;16(4):14-7.
American Nurse Journal. 2022; 27 (11). Doi: 10.51256/ANJ112244