
Don’t let P values distract you from scientific reasoning.
- P values are useful to report the results of inferential statistics, but they aren’t a substitute for scientific reasoning.
- After a statistical analysis of data, the null hypothesis is either accepted or rejected based on the P value.
- Reading statistical results includes summary statistics (descriptive statistics), test statistics, and P value with other considerations such as one-tailed or two-tailed test, and sample size.
Improper interpretation of statistical analysis can lead to abuse or misuse of results. We draw valid interpretations when data meet fundamental assumptions and when we evaluate the probability of errors. Statistical analysis requires knowledge for proper interpretation, which relies on considering the null hypothesis, two-tailed or one-tailed tests, study power, type I and type II errors, and statistical vs. clinical significance. In many domains, including nursing, statistical significance (P value) serves as an important threshold for interpretation, whether the result is statistically significant or not. However, statistical significance frequently is misunderstood and misused.
Statistical test components
In empirical research, all statistical tests begin with the null hypothesis and end with a test statistic and the associated statistical significance. A test of statistical significance determines the likelihood of a result assuming a null hypothesis to be true. Depending on the selected statistical analysis, researchers will use Z scores, t tests, or F tests. Although three methods exist for testing hypotheses (confidence intervals [CIs], P values, and critical values), essentially the P value serves as the significance level. Many researchers consider P values the most important summary of an inferential statistical analysis.
Null hypothesis
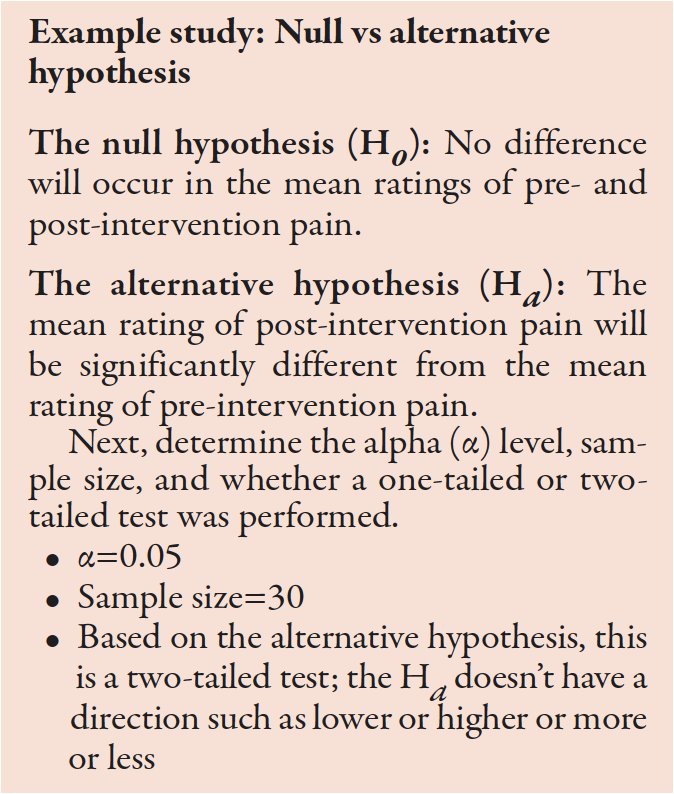
Before conducting a study, researchers propose a null hypothesis, which begins with an initial idea they want to demonstrate. It guides the statistical analysis and predicts the direction and nature of study results. Traditionally, a null hypothesis proposes no difference between two variables being studied or the characteristics of a population. An alternative hypothesis states a result that’s either not equal to, greater than, or less than the null hypothesis.
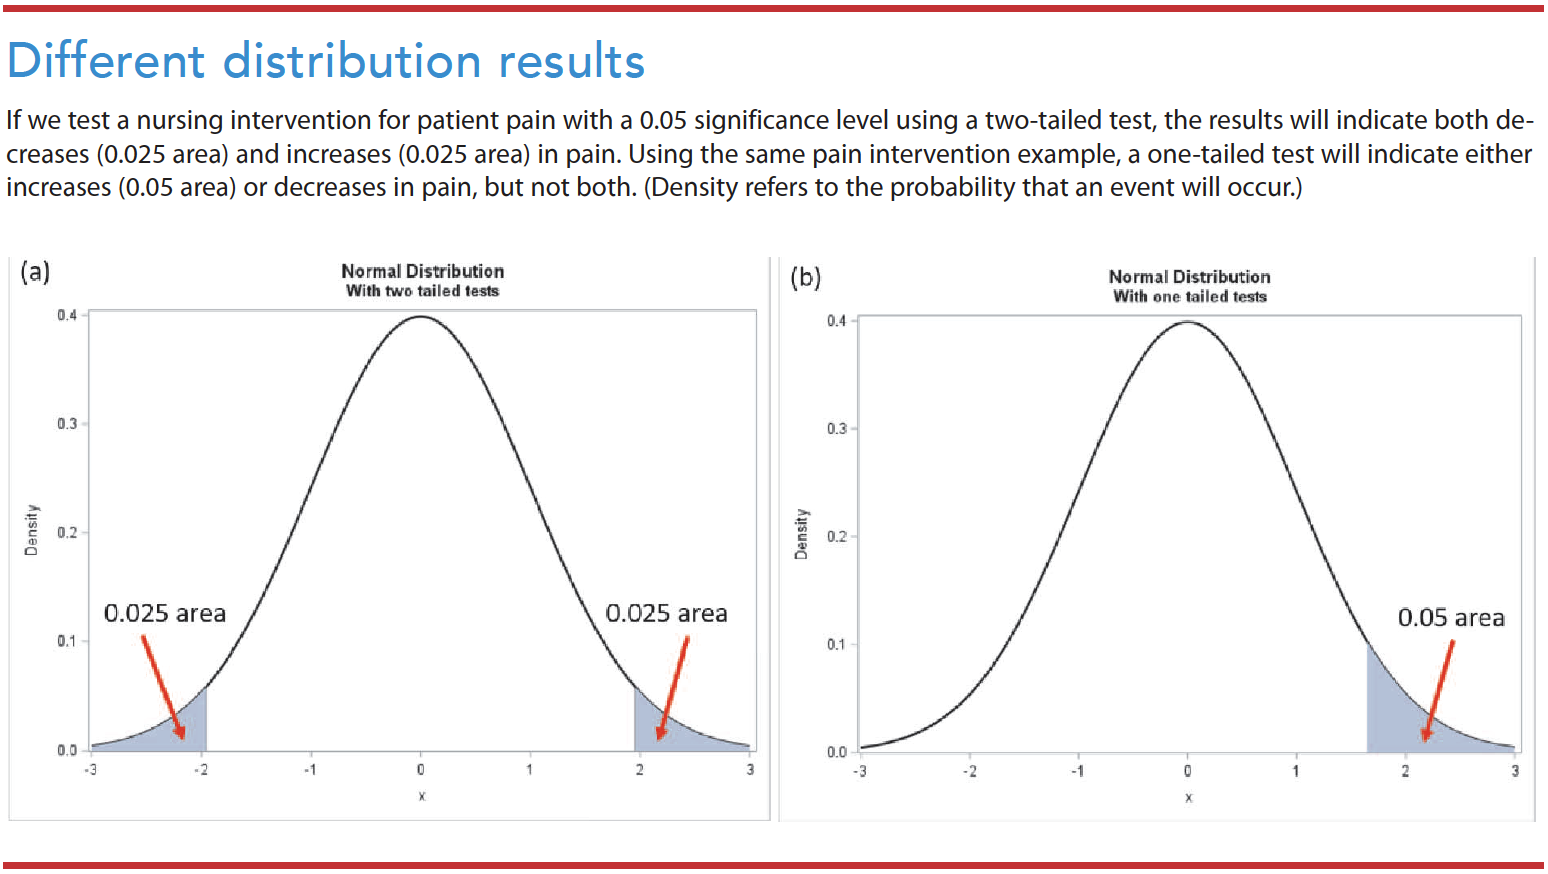
Two-tailed test vs. one-tailed test
Researchers commonly check a null hypothesis or statistical significance using a two-tailed test, which postulates that the sample mean is equal or unequal to the population. A one-tailed test postulates that the sample mean is higher or lower than the population mean. Nursing researchers rarely use a one-tailed test because of the consequences of missing an effect. (See Different distribution results.)
Study power and type I/type II errors
The possibility of error exists when testing a hypothesis. Type I errors (false alarms) occur when we reject a null hypothesis that’s true. Type II errors (misses) occur when we accept a null hypothesis that’s false. Sample size can influence the power of the study. For example, even small treatment effects can appear statistically significant in a large sample.
The alpha (α)—the probability of a type I error—refers to the likelihood that the truth lies outside the confidence interval (CI). The smaller the α, the smaller the area where we would reject the null hypothesis, which reduces the chance that will occur. The most widely acceptable α cutoff in nursing research is 0.05. Keep in mind that the confidence level and α are analogous. If the α=0.05, the confidence level is 95%. If α=0.01, the confidence level is 99%.
Confidence interval
A CI provides an idea of the range within which a value might occur by chance. It indicates the strength of the estimate by providing a range of uncertainty. Frequently, researchers use CIs without a dichotomous result of the P value. Consider the following example: On a scale between 0 and 10, patients with an advanced illness reported an average pain score of between 4.1 and 6.3 (95% CI: 4.1 to 6.3). With a 95% CI, researchers risk being wrong 5 out of 100 times.
Statistical vs. clinical significance
Statistical significance indicates the study results’ confidence in probability, while the clinical significance reflects its impact on clinical practice. Measures of statistical significance quantify the probability that a study result is due to chance rather than a real treatment effect. On the other hand, clinical significance indicates the magnitude of the actual treatment effect or impact in nursing practice.
Consider this example: Researchers compare two groups (exercise group and diet group). The mean body weight of subjects after treatment with exercise is 1 pound lower than after treatment with diet. The difference between these groups could be statistically significant, with a P value of <0.05. However, the clinical implications of a 1 pound weight loss wouldn’t be clinically significant. In this example, the mean weight—172 pounds (exercise group) vs. 173 pounds (diet group), P=0.04—is statistically significant. The 0.04 P value means only a 4% chance exists that this observed weight difference occurred randomly. However, the clinical significance of a 1 pound difference between the groups would be considered small and not clinically significant.
P value
The results section of a quantitative research study report includes names of statistical tests, the value of the calculated statistics, and the statistical significance (P value). After a statistical analysis of data, the null hypothesis is either accepted or rejected based on the P value. For example, if a report indicates a significant finding at the 0.05 probability level (α=0.05), the findings might have an error 5% of the time (only 5 out of 100) and a 95% confidence that the results aren’t erroneous after repeated testing. (See P value examples.)
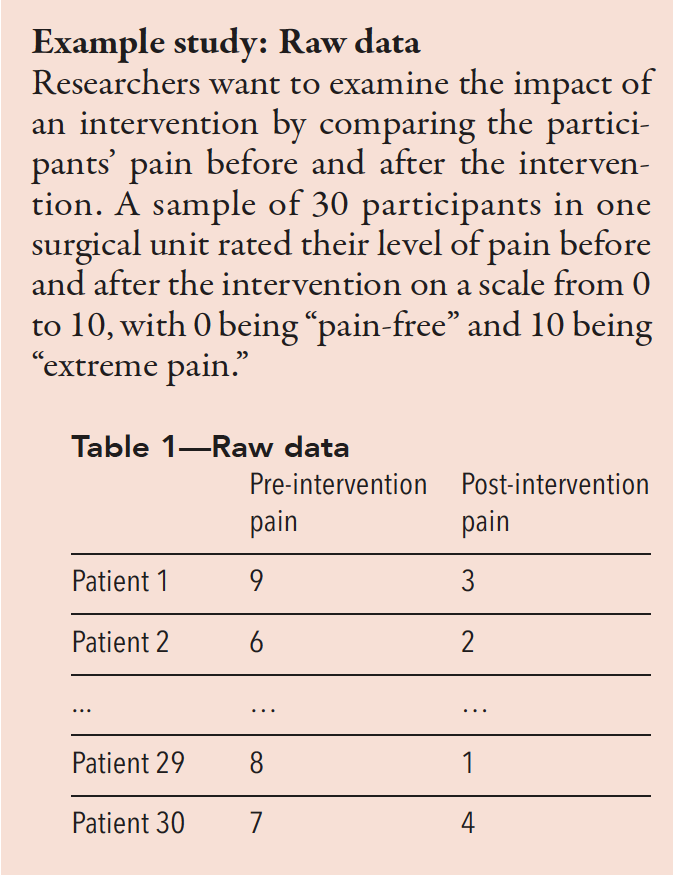
Study example: Reading results and tables
Use the mean to understand the center of the data. Most statistical analyses use the mean and/or median for a central tendency. Also, use the standard deviation (SD) to understand how widely spread the data are from the mean. As shown in Table 2, the mean of pre-intervention pain is 7.2, while the mean of post-intervention pain is 4.6. The SD in pre-intervention pain is 1.4, and the SD in post-intervention pain is 1.8. A higher SD value indicates a greater spread in the data.
Table 2—The mean and SD of pre- and post-intervention pain for 30 patients
| Mean | N | SD | |
| Pre-intervention pain | 7.2 | 30 | 1.4 |
| Post-intervention pain | 4.6 | 30 | 1.8 |
Table 3 shows a mean difference between pre- and post-intervention pain of 2.5667. Based on the t-test results, the t score is 7.92. The confidence interval (CI) is 95% for the mean difference, with pre- and post-intervention pain scores ranging from 1.41 to 2.39.
Table 3—Paired samples t-test of change score
| Mean | SD | Standard error mean | ||
| Pair 1 | Pre-intervention to post-intervention pain scores | 2.5667 | 1.775 | 0.324 |
95% CI of the difference
| Lower | Upper | t | df | Significance (two-tailed) |
| 1.4136 | 2.3861 | 7.92 | 29 | <0.001* |
*P<0.05
Next, find the associated P values
- If P<α (0.05), reject the H0 and accept the Hα.
- If P>α (0.05), accept the H0.
In this example, P<0.001, which means the Ho can be rejected. We accept the Hα that the mean post-intervention pain score is significantly different from the mean pre-intervention pain score.
Interpreting statistical results
Reading and interpreting statistical results includes summary statistics (descriptive statistics), test statistics, and P value with other considerations such as one-tailed or two-tailed test, sample size, and multiple comparisons. We must not only understand the decision to accept or reject a hypothesis based on a test used, but also understand the descriptive statistics and other considerations such as normality and equal variance. For complex statistics, tables provide the most effective way to view the results.
Based on Tables 1 and 2, the average pre-intervention pain score (mean=7.2, SD=1.4) is higher than the post-intervention pain score (mean=4.6, SD=1.8). We can conclude that post-intervention pain was statistically significantly lower than pre-intervention pain (t=7.92, P<0.001).The difference in average pain scores was 2.6 after the intervention. The result was statistically significant. We can conclude that the improvement (an average, 2.6 lower than the pre-intervention pain) also was clinically significant.
Rely on scientific reasoning
Quantitative nursing research uses a testing hypothesis in decision making. P values are useful for reporting the results of inferential statistics, but we must be aware of their limitations. The P value isn’t the probability that the null hypothesis is true but the probability of the test statistics against a null hypothesis. It measures the compatibility of data with the null hypothesis but can’t reveal whether an alternative hypothesis is true. Also keep in mind that the 0.05 significance level is merely a convention. Researchers commonly use it as a threshold whether it’s statistically significant or not.
P values were never intended as a substitute for scientific reasoning. All results should be interpreted in the context of the research design (sample size, measurement validity or reliability, and study design rigor).
Joohyun Chung is a biostatistician and assistant professor at the University of Massachusetts Elaine Marieb College of Nursing in Amherst.
American Nurse Journal. 2023; 18(2). Doi: 10.51256/ANJ022345;
Key words: P value, statistical significance, significance level
References
Andrade C. The P value and statistical significance: Misunderstandings, explanations, challenges, and alternatives. Indian J Psychol Med. 2019;41(3):210-5. doi:10.4103/IJPSYM.IJPSYM_193_19
Cook C. Five per cent of the time it works 100 per cent of the time: The erroneousness of the P value. J Man Manip Ther. 2010;18(3):123-5. doi:10.1179/106698110X12640740712257
Heavey E. Statistics for Nursing: A Practical Approach. 3rd ed. Burlington, MA: Jones & Bartlett Learning; 2018.
Houser J. Nursing Research: Reading, Using, and Creating Evidence. 4th ed. Burlington, MA: Jones & Bartlett Learning; 2018.
Ioannidis JPA. The importance of predefined rules and prespecified statistical analyses: Do not abandon significance. JAMA. 2019;321(21):2067-8. doi:10.1001/JAMA.2019.4582
Polit DF, Beck CT. Essentials of Nursing Research: Appraising Evidence for Nursing Practice. 10th ed. Philadelphia, PA: Lippincott Williams & Wilkins; 2021.
Ranganathan P, Pramesh CS, Buyse M. Common pitfalls in statistical analysis: Clinical versus statistical significance. Perspect Clin Res. 2015;6(3):169-70. doi:10.4103/2229-3485.159943
Wasserstein RL, Lazar NA. The ASA statement on p-values: Context, process, and purpose. Am Stat. 2016;70(2):129-33. doi:10.1080/00031305.2016.1154108